In 1771 Jan Ingenhousz showed that green plants release oxygen in sunlight, a discovery that helped reveal photosynthesis as life’s fundamental energy engine.
Photosynthesis is simple to state: light plus CO₂ yields sugar and O₂, but the underlying machinery is delicate. When that machinery falters, plants respond predictably — and spotting those responses early can save houseplants, market gardens, or entire fields from serious loss.
This practical, numbered guide lists 10 observable and measurable signs of photosynthesis problems, grouped into three useful categories: visual leaf cues, growth and reproductive effects, and physiological measurements. Each sign explains what to look for, why it happens, and what you can do next. Read it as a field checklist you can use on a quick patrol or a lab reference for targeted diagnosis.
Visual leaf symptoms

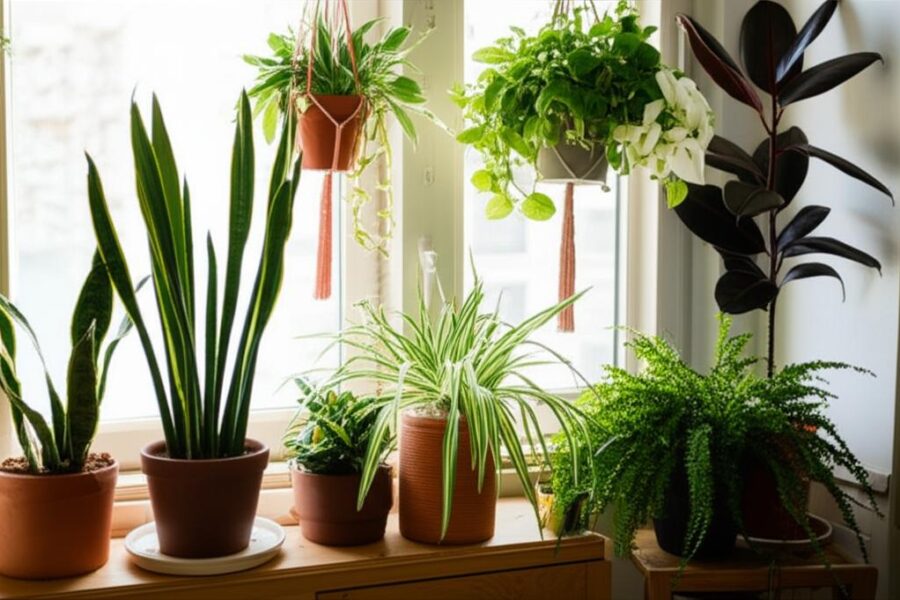
Leaves are the primary site of light capture and carbon fixation, so they show trouble first. Visual changes can point to nutrient shortages, light stress, root trouble, or pathogens.
Quick checks that narrow causes: compare older versus newer leaves, note interveinal vs whole-leaf patterns, and check soil moisture and pH. These non‑invasive observations are fast tools for gardeners and field scouts.
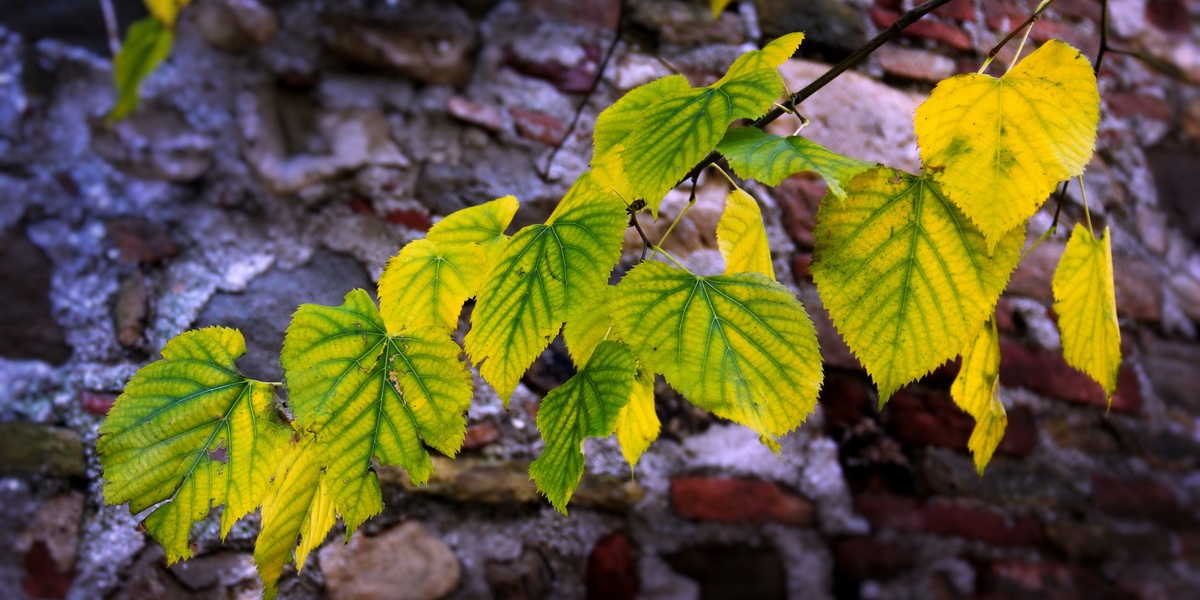
1. Chlorosis (yellowing leaves)
Chlorosis is leaf yellowing caused by reduced chlorophyll. Less chlorophyll means lower light capture and slower electron transport, so photosynthesis drops as color fades.
Use a SPAD meter when available: healthy leaves often read ~35–50, while chlorotic tissue commonly falls below ~25. Nutrient links are typical: iron deficiency causes interveinal yellowing with green veins, magnesium or nitrogen shortages often cause whole‑leaf paleness.
Real-world cues: citrus on calcareous (high‑pH) soils often shows iron chlorosis, whereas corn with nitrogen shortage shows uniform yellowing starting on older leaves. A simple rub test helps: if veins stay green while the blade is yellow, suspect iron.
2. Necrosis or browning (dead leaf tissue)
Necrosis appears as brown, dead patches or scorched margins. Dead tissue no longer photosynthesizes, so necrosis often marks an advanced or prolonged problem.
Common causes include salt burn, severe drought, chemical scorch, or vascular and root diseases. Necrosis usually follows days to weeks of unmanaged stress and signals urgency.
Examples: coastal ornamentals get margin necrosis after salt spray storms; bacterial or fungal vascular diseases produce brown streaks and rapid collapse in crops such as tomato. Remove heavily necrotic tissue to limit pathogen spread, but understand that lost leaf area won’t be recovered.
3. Purpling or reddening of leaves
Leaves turning purple or red often reflect anthocyanin buildup — a protective pigment response to stress. That pigment can indicate carbohydrate imbalances, low phosphorus availability, or cold stress that reduce photosynthetic throughput.
Typical scenarios include cool nights with sunny days (seedlings often purple) and phosphorus‑limited soils where stems and older leaves show purpling. The change can be reversible if the trigger is brief.
Field example: corn or wheat seedlings in cold spring soils may show purple leaves because phosphorus uptake is limited at low soil temperatures. For ornamentals, sudden reddening after a late frost is common and often temporary.
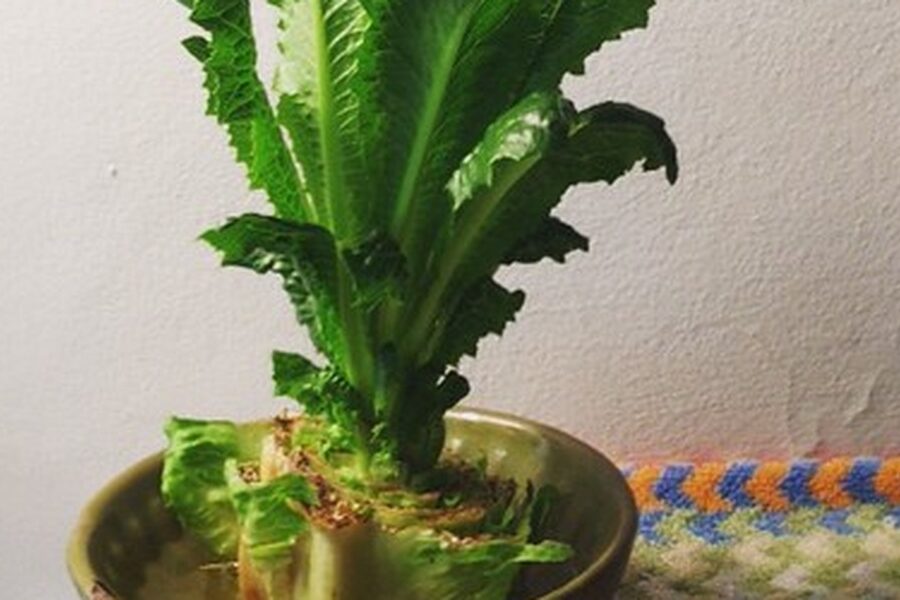
4. Wilting despite adequate soil moisture
When plants wilt even though the soil is moist, the problem is usually root or vascular rather than drought. Roots or xylem that can’t move water also limit CO₂ uptake and stomatal function, suppressing photosynthesis and turgor.
Root rot pathogens like Phytophthora, nematode infestations, or xylem‑blocking bacteria cause wilting within days. Check roots for softness, discoloration, or a foul smell, and inspect stems for girdling or lesions.
Practical instances: boxwoods that wilt after irrigation often harbor Phytophthora root rot; grapevines with xylem-limited diseases such as Pierce’s disease show rapid wilting and decline. Fixes usually target the root zone — improving drainage or treating pathogens where possible.
Growth and reproductive effects
Photosynthesis supplies the sugars plants need to build leaves, stems, flowers, and fruit. When carbon gain drops, biomass and reproductive effort decline — which translates directly into lower yields for growers.
Simple monitoring metrics include plant height, leaf area index, and counts of flowers or fruits over time. These are practical measurements for vegetable growers, nurseries, and field scouts.
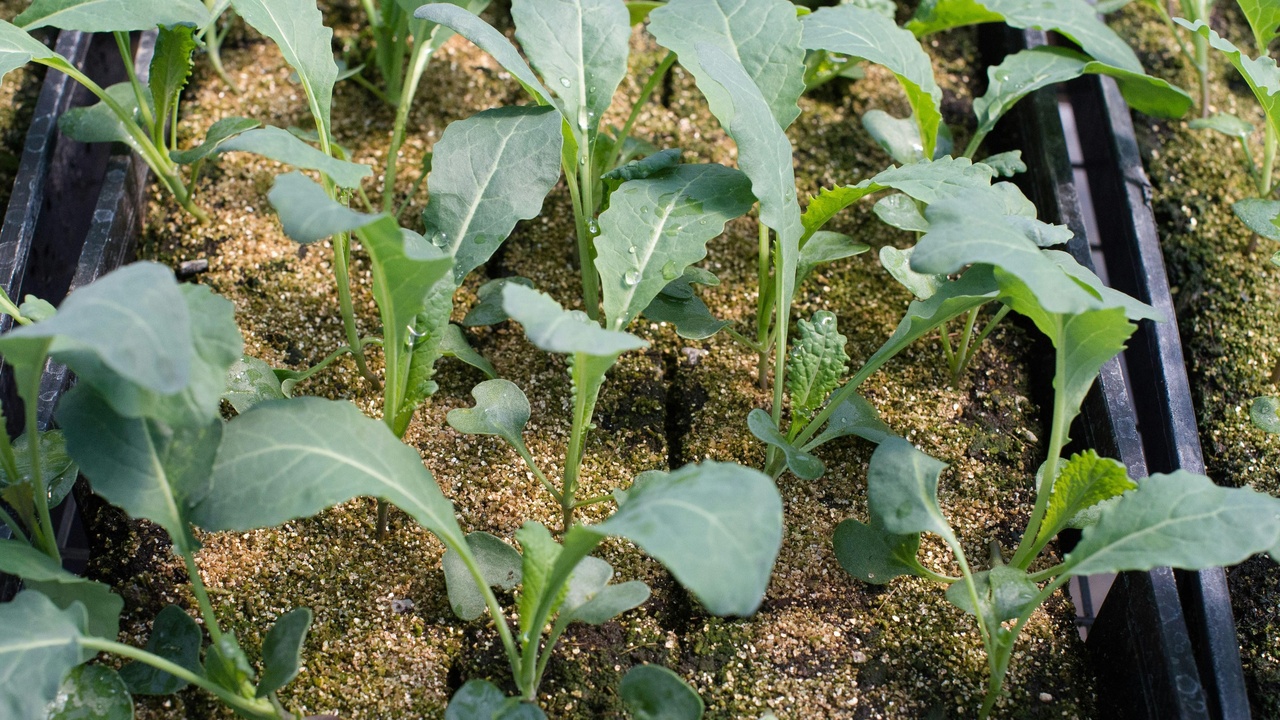
5. Stunted growth and small leaves
Small overall size and undersized leaves often point to chronic low photosynthetic production. Plants convert less carbon into structural and storage tissues, so height and leaf area lag expected benchmarks.
Magnitude varies by species, but stressed plants can show 20–70% less biomass accumulation depending on severity. Comparing plants to healthy controls or expected crop growth curves helps quantify the deficit.
Examples include greenhouse bedding plants that remain undersized under low PPFD (e.g., 50 μmol·m−2·s−1 versus a recommended 150–300) and wheat that produces shorter stems and fewer tillers after early frost stress.
6. Reduced flowering or fruit set
When carbohydrate supply is scarce, plants commonly drop flowers or abort developing fruit to conserve resources. That trade‑off directly cuts marketable yield.
Even short-term reductions in photosynthesis during bloom can reduce yields by 10–40% in sensitive crops. Timing matters: stress during flowering is disproportionately damaging compared with vegetative stress at other stages.
Practical advice: protect bloom with shade cloth or timely irrigation in heat waves. Typical cases are tomato blossom drop during consecutive hot afternoons and apple biennial bearing worsened by a season of low carbohydrate buildup.
7. Excessive leaf drop and premature senescence
Plants will shed leaves early to reduce maintenance costs when photosynthetic capacity falls below what’s needed for respiration and repair. Premature senescence signals a persistent energy shortfall.
Leaf loss reallocates limited sugars away from older tissue and toward survival; for perennials, early defoliation also reduces carbohydrate reserves for the next season, lowering future productivity.
Examples: soybean fields often show accelerated senescence during drought years, and shade-stressed houseplants commonly drop lower leaves first. Track leaf retention trends seasonally to catch chronic problems early.
Physiological and measurable signs

Some of the clearest indicators of impaired photosynthesis require measurement: chlorophyll content, gas exchange rates, and chlorophyll fluorescence. These tools give quantitative confirmation and often detect trouble before leaves look bad.
They’re commonly used by researchers, extension agents, and commercial growers to prioritize interventions and to separate stomatal from biochemical limitations to photosynthesis.
8. Low chlorophyll readings (SPAD or pigment assays)
SPAD meters and pigment assays estimate chlorophyll, a direct proxy for photosynthetic capacity. SPAD is unitless but correlates tightly with chlorophyll concentrations in many crops.
Common ranges: healthy leaves often score ~35–50, while values below ~25 suggest deficiency. Agronomists use these thresholds to time nitrogen applications or investigate micronutrient problems.
Examples: rice breeding trials use SPAD to select nitrogen‑efficient lines; greenhouse vegetable growers target SPAD 38–45 during vegetative growth for optimal vigor. Always pair SPAD readings with a visual check and soil test for a complete picture.
9. Low CO₂ assimilation / reduced photosynthetic rate
Gas‑exchange systems measure the photosynthetic rate (A, in μmol CO₂·m⁻²·s⁻¹) and are the most direct indicator of carbon assimilation. C3 leaves in good conditions often range 10–25 μmol·m⁻²·s⁻¹.
Stressed leaves can drop to 2–5 μmol·m⁻²·s⁻¹. Causes include stomatal closure (limits CO₂), biochemical limits such as reduced Rubisco activity, or sink limitations limiting carbohydrate use.
Practical uses: crop physiologists use portable IRGA systems to quantify stress responses and gauge treatment effects. For instance, a tomato leaf may fall from ~15 to <5 μmol·m⁻²·s⁻¹ within days of drought, signaling urgent remediation.
10. Reduced chlorophyll fluorescence (low Fv/Fm)
Chlorophyll fluorescence — specifically the maximum quantum yield Fv/Fm — is a sensitive indicator of PSII photochemical efficiency. Healthy unstressed leaves commonly show ~0.83.
Values below ~0.75 indicate photoinhibition or other stress to PSII. Fluorescence often detects subclinical stress before visual symptoms appear, making it a powerful screening tool.
Use cases: plant physiologists and breeders screen seedlings with fluorometers to identify tolerant lines. Seedlings exposed to a heatwave can drop from 0.83 to ~0.65, which flags need for shade or cooler propagation conditions.
Summary
- Leaves provide fast, non‑invasive clues, but instruments (SPAD, gas‑exchange, fluorometers) reveal problems earlier and more precisely.
- Stress during flowering and early growth stages causes disproportionate yield loss; monitor bloom and vegetative benchmarks closely.
- Combine visual checks (chlorosis, necrosis, purpling, wilting) with simple measurements (SPAD <25, A dropping below ~5 μmol·m⁻²·s⁻¹, Fv/Fm <0.75) to prioritize fixes.
- Practical first steps this week: inspect older versus newer leaves, take a soil pH or nutrient test, check root health if wilting, and record one SPAD or fluorescence reading if the equipment is available.