Compacted soils can cut crop yields by roughly 10–30% in affected fields and sharply increase runoff during storms.
Compaction happens when pore space is squeezed out of the root zone—most commonly after repeated passes by heavy machinery, concentrated foot traffic, or fieldwork conducted while soils are wet. That reduced pore space restricts root growth, lowers water infiltration, and raises erosion and nutrient-loss risk; compacted layers are often found 10–30 cm below the surface in worked fields (USDA NRCS, FAO).
Being able to recognize the signs of soil compaction early gives farmers, landscapers, and gardeners a real chance to reverse damage, protect yields, and restore soil health. Below are seven clear, evidence-backed indicators and what each one means in practical terms.
Surface and visual signs

Visual clues are often the first hints that something’s wrong below ground. Surface crusting, standing water, and visible wheel ruts point to reduced infiltration and increased runoff, problems the USDA Natural Resources Conservation Service and the FAO have linked to compacted, poorly aggregated topsoils. Spotting these signs lets you act quickly—avoid working soils while wet, cut down the number of passes with heavy equipment, and protect residue cover to limit further damage.
1. Surface crusting and hard crust formation
Surface crusting happens when raindrops break down fine aggregates and a compacted top layer seals, forming a hard crust that blocks seedlings and slows water entry. Crusting can cut seedling emergence by roughly 10–25% in sensitive crops (USDA NRCS guidance notes crusting is common where fine-textured, low-residue soils are exposed).
You’ll see it in vegetable beds and newly seeded pastures as missing or patchy germination—carrot and lettuce seedlings that never reach the light are classic examples. Quick checks are simple: rub the surface gently to see if it resists breaking, and use light cultivation when the surface is dry or add mulch/plant residues to protect the soil.
2. Poor infiltration and standing water after rain
Compacted areas shed water instead of absorbing it, leaving puddles and slow-draining spots after even modest rain. Infiltration rates in compacted zones can fall dramatically—sometimes by up to half—leading to more surface runoff and higher erosion and nutrient loss (see USDA NRCS and FAO notes on runoff risks).
Common field examples include livestock paddocks with persistent hoof puddles and lawns that remain soggy for 24 hours or more after a light shower. A simple on-farm test: pour a measured cup of water into a shallow hole and time how long it takes to disappear. Persistent pooling suggests restricted pore continuity and potential oxygen stress for roots.
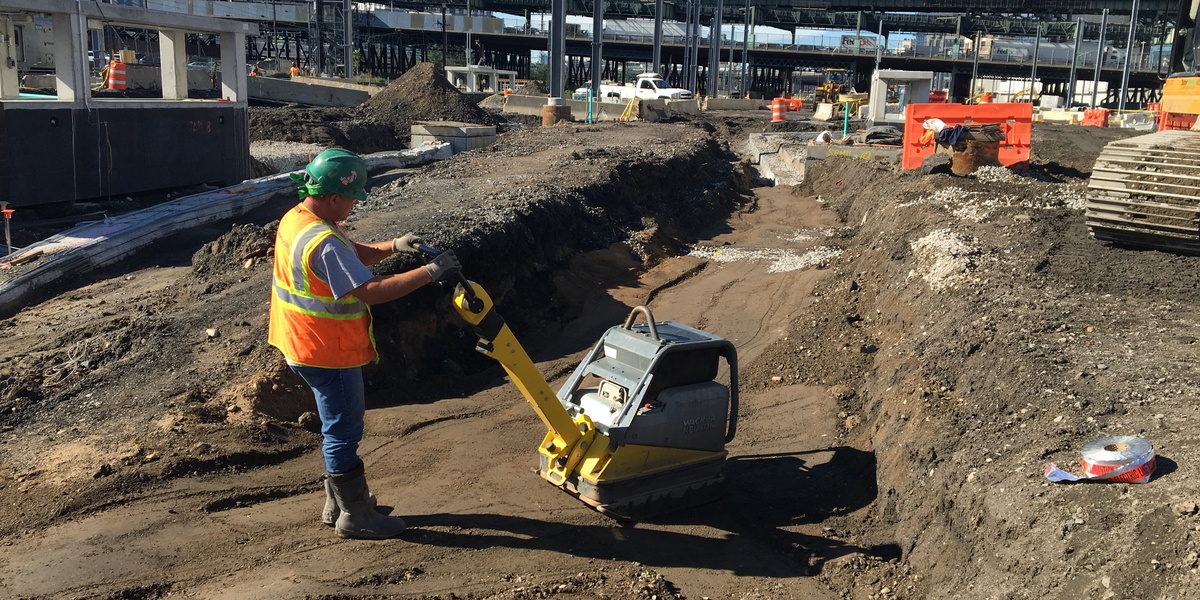
3. Visible wheel ruts, rills, and hardened tracks
Wheel ruts and compacted tracks are direct evidence that mechanical pressure has densified the soil. Repeated passes of heavy machinery—think combine or tractor axle loads in the several tonnes range—can compact soil to depth and form persistent bands of reduced porosity.
Look for consistent tracks across growing seasons; they often map exactly to low-yield strips. Practical fixes include adopting controlled-traffic farming, reducing axle loads, and postponing passes until soils are drier. Even cutting a few passes per season makes a noticeable difference over time.
Plant growth and root indicators

Plants reflect what’s happening underground. When roots can’t penetrate a compacted layer, aboveground symptoms appear—stunting, patchy stands, or nutrient-like yellowing. Digging a spade-slice to inspect roots is one of the quickest, most informative diagnostics a grower can do.
4. Stunted growth, patchy stands, and reduced yields
Compaction commonly shows as uneven plant size, chlorosis, and lower vigor in defined strips or patches. Heavily compacted areas can suffer 10–30% yield reductions compared with well-structured soil, especially after repeated wet-season traffic (extension bulletins and peer-reviewed studies document these ranges for many row crops).
Cash crops respond differently—corn may show delayed tassel and smaller ears in compacted bands, while pastures may decline more gradually. To avoid a false diagnosis, pair visual checks with root inspections and focused soil tests; nutrient deficiency symptoms can mimic compaction effects.
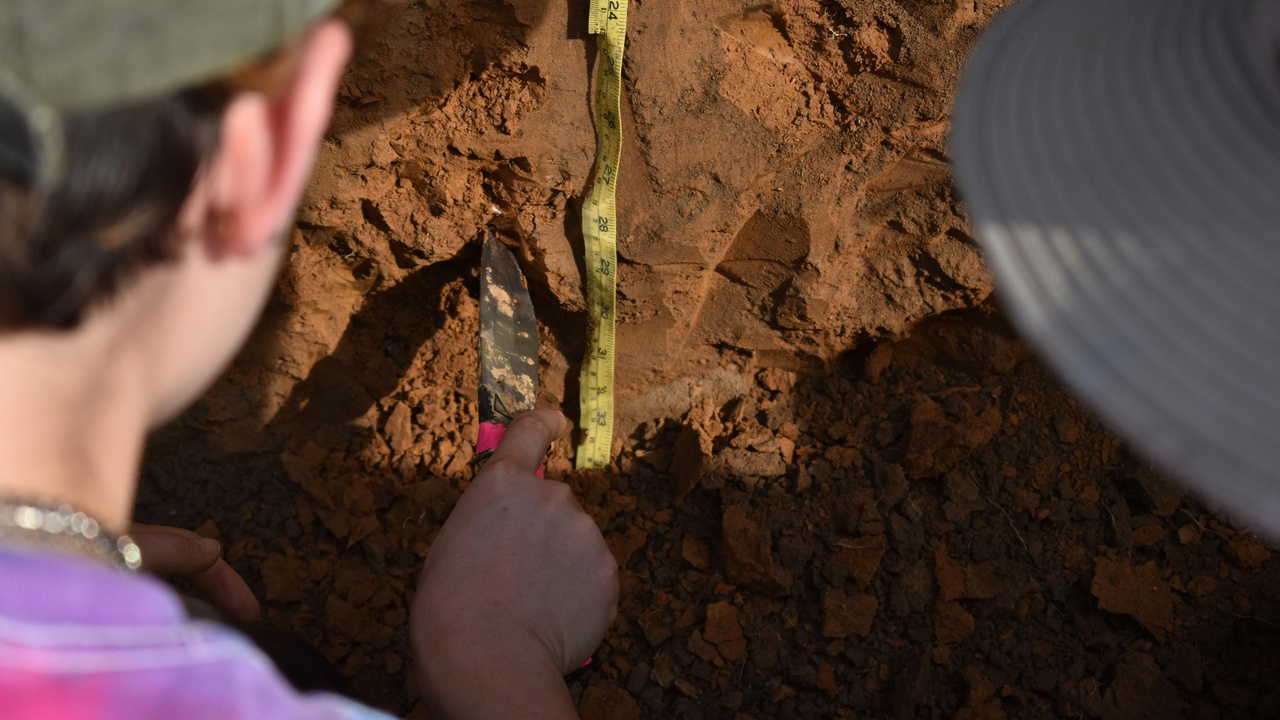
5. Shallow, forked, or distorted roots
Restricted root systems—roots that stop abruptly, branch laterally, or become forked—are classic belowground signs of compaction. Roots tend to spread sideways above a dense layer instead of growing down through it.
Objective thresholds help interpret what you see: in many loam soils, bulk density above about 1.4–1.6 g/cm³ constrains root growth, and penetrometer resistances around 1.5–2.0 MPa (1500–2000 kPa) commonly impede many crop roots. Dig a 20–30 cm spade slice, photograph the root architecture, and compare across spots to map problem zones.
Soil physical tests and biological cues
When visual and plant signs point to trouble, simple measurements and biological checks provide confirmation. Bulk density and penetrometer tests convert observations into numbers, while earthworm and soil-life counts reveal functional impacts on aeration and decomposition. Combining methods gives the clearest picture of severity and depth.
6. High bulk density and elevated penetrometer resistance
Bulk density and penetrometer readings give objective proof of compaction. For many loams, bulk density above roughly 1.4–1.6 g/cm³ limits root growth, and penetrometer resistances above about 1.5–2.0 MPa (1500–2000 kPa) often prevent root extension for common crops.
Use a core sampler for bulk density (report g/cm³) and a hand penetrometer for resistance (report kPa or MPa). Sample multiple locations and depths (0–10 cm, 10–20 cm, 20–30 cm) and record values. Many land-grant extension offices lend equipment and can help interpret results relative to local soils.
7. Decline in earthworms and other soil life
Healthy, well-aggregated soils support abundant earthworms and microbial activity; compaction reduces pore space and oxygen, and populations fall. Studies and extension notes report declines ranging from tens of percent to more than half in heavily compacted or disturbed soils.
A simple biological check: dig a 20×20×20 cm block and count earthworms. Region-dependent expectations vary, but finding only a handful suggests low activity; dozens would indicate a healthy system. Restorative steps—adding organic matter, reducing traffic, and planting cover crops—help rebuild habitat and soil fauna over seasons.
Summary
- Signs of soil compaction are visible as crusts, ruts, and puddles that make poor seedling emergence and runoff obvious.
- Plant symptoms—stunted patches, delayed tassels, and distorted roots—often map directly to compacted layers; dig spade slices to check root depth and branching.
- Confirm suspicions with measurements: bulk density cores and penetrometer readings (sample at several depths) give objective thresholds, while simple earthworm counts show biological impact.
- First remediation steps: stop traffic when soils are wet, reduce axle loads or adopt controlled-traffic patterns, add surface residues or mulch, and use cover crops and organic amendments to rebuild structure over time.
- Practical next steps this season: perform a quick infiltration cup test and a spade-slice root check, document results with photos, and contact your local extension office for region-specific bulk density thresholds and loaner equipment.