A 1-year-old cat is 15 in human years and a 2-year-old is 24. After that the standard vet chart adds 4 human years per cat year, and this cat years calculator adds about 5 for a domestic cat, more for short-lived breeds and fewer for long-lived ones. A 10-year-old domestic cat is 64 in human years and a 15-year-old is 83.
How to use the cat years calculator
Pick a breed, enter your cat’s age and the calculator returns the human-equivalent age, the life stage, the age your cat becomes a senior and the age at which it reaches its next human decade. It also converts human years to cat years and shows the vet chart and the multiply-by-7 rule next to the result.
- Pick a breed or “Domestic shorthair / mixed / not sure”. The breed sets the expected lifespan. The domestic option covers shorthair, medium-hair and longhair cats, tabbies, tuxedos, calicos, rescues and strays. Of the 54 breed profiles, 10 rest on UK death records and 44 are labelled as estimates.
- Enter your cat’s age. Use years and months, or a birth date. Months matter in the first two years, when a cat ages fastest.
- Read the result. You get the human-equivalent age, the life stage and the age at which your cat reaches the senior stage.
- Switch to human to cat to turn a human age into a cat age for the same breed. The conversion is the exact inverse of the cat-to-human one.
Ages past a breed’s typical lifespan are labeled “past the typical lifespan for the breed”. That describes where the cat sits on the breed’s survival curve. It is not a prognosis, and many cats live well beyond the median.
The dog years calculator uses the same method for dogs. The full set of tools is on the calculators page.
Cat years to human years chart
This chart gives the human-equivalent age for cats aged 1 to 25. The domestic column is a domestic shorthair or mixed-breed cat, whose median age at death is 13.0 years. The Bengal (median 8.4) and the Birman (median 15.5) are the shortest- and longest-lived breeds with at least 30 deaths in the UK data. Look your breed up in the breed table below.
| Cat age | Domestic / mixed (median 13.0) | Vet chart (AAFP-AAHA) | Bengal (median 8.4) | Birman (median 15.5) | ×7 rule |
|---|---|---|---|---|---|
| 1 | 15 | 15 | 15 | 15 | 7 |
| 2 | 24 | 24 | 24 | 24 | 14 |
| 3 | 29 | 28 | 33 | 28 | 21 |
| 4 | 34 | 32 | 41 | 32 | 28 |
| 5 | 39 | 36 | 50 | 36 | 35 |
| 6 | 44 | 40 | 58 | 40 | 42 |
| 7 | 49 | 44 | 67 | 44 | 49 |
| 8 | 54 | 48 | 76 | 48 | 56 |
| 9 | 59 | 52 | 81 | 53 | 63 |
| 10 | 64 | 56 | 85 | 57 | 70 |
| 11 | 69 | 60 | 88 | 61 | 77 |
| 12 | 74 | 64 | 92 | 65 | 84 |
| 13 | 79 | 68 | 95 | 69 | 91 |
| 14 | 81 | 72 | 99 | 73 | 98 |
| 15 | 83 | 76 | 102 | 77 | 105 |
| 16 | 85 | 80 | 106 | 80 | 112 |
| 17 | 87 | 84 | 109 | 82 | 119 |
| 18 | 89 | 88 | 113 | 83 | 126 |
| 19 | 91 | 92 | 116 | 85 | 133 |
| 20 | 93 | 96 | 120 | 87 | 140 |
| 21 | 95 | 100 | 122 | 88 | 147 |
| 22 | 97 | 104 | 122 | 90 | 154 |
| 23 | 100 | 108 | 122 | 92 | 161 |
| 24 | 102 | 112 | 122 | 93 | 168 |
| 25 | 104 | 116 | 122 | 95 | 175 |
The chart in short form: 1 cat year = 15 human years, 2 = 24, 5 = 39, 10 = 64, 15 = 83, 20 = 93.
Every column is 15 at year 1 and 24 at year 2, because the first two years follow the vet chart for every breed. From year 3 the breeds separate: a 10-year-old cat is 57 for a Birman, 64 for a domestic cat and 85 for a Bengal.
The domestic column runs ahead of the vet chart from year 3 to 18, by as much as 11 years at year 13 (79 against 68), and falls behind it from year 19 (93 against 96 at year 20 and 104 against 116 at year 25). The vet chart section explains why. The Bengal column reaches 122, the age of the oldest verified person, at cat year 21 and stays there.
Cat age chart by life stage
Vets divide a cat’s life into four stages by age: kitten, young adult, mature adult and senior. The 2021 AAHA/AAFP Feline Life Stage Guidelines add a fifth, end of life, which applies at any age and depends on health, not years.
| Stage | 2021 AAHA/AAFP ages | Starts at (cat years) | Human age at start: domestic | Bengal | Birman |
|---|---|---|---|---|---|
| Kitten | birth to 1 year | 0 | 0 | 0 | 0 |
| Young adult | 1 to 6 years | 1 | 15 | 15 | 15 |
| Mature adult | 7 to 10 years | 7 | 49 | 67 | 44.4 |
| Senior | over 10 years (calculator: from 11) | 11 | 69 | 88.2 | 60.7 |
The stage ages are fixed and do not change with breed. The human equivalent of those ages does: a cat entering the senior stage at 11 is 69 for a domestic cat, 88.2 for a Bengal and 60.7 for a Birman.
Kitten age in human years
A kitten gains 12 human years in its first 7 months and 3 in the next 5. The values below are the same for every breed.
| Kitten age | Human age | Stage |
|---|---|---|
| 1 month | 1 | Kitten |
| 2 months | 2 | Kitten |
| 3 months | 4 | Kitten |
| 4 months | 6 | Kitten |
| 5 months | 8 | Kitten |
| 6 months | 10 | Kitten |
| 7 months | 12 | Kitten |
| 8 months | 12.6 | Kitten |
| 9 months | 13.2 | Kitten |
| 10 months | 13.8 | Kitten |
| 11 months | 14.4 | Kitten |
| 12 months | 15 | Young adult |
| 18 months | 21 | Young adult |
| 24 months | 24 | Young adult |
A 3-month-old kitten is 4 in human years, a 6-month-old is 10 and a 12-month-old is 15.
Human years to cat years chart
To convert the other way, find the human age in the first column. The cells give the cat’s age in years (y) and months (mo). A 15-year-old person matches a 1-year-old cat, a 24-year-old matches a 2-year-old and a 50-year-old matches a domestic cat of 7 years 2 months.
| Human age | Domestic / mixed | Bengal | Birman | Vet chart (years) |
|---|---|---|---|---|
| 5 | 4 mo | 4 mo | 4 mo | 0.3 |
| 10 | 6 mo | 6 mo | 6 mo | 0.5 |
| 15 | 1 y | 1 y | 1 y | 1.0 |
| 18 | 1 y 3 mo | 1 y 3 mo | 1 y 3 mo | 1.3 |
| 21 | 1 y 6 mo | 1 y 6 mo | 1 y 6 mo | 1.5 |
| 25 | 2 y 2 mo | 2 y 1 mo | 2 y 3 mo | 2.3 |
| 30 | 3 y 2 mo | 2 y 8 mo | 3 y 6 mo | 3.5 |
| 35 | 4 y 2 mo | 3 y 3 mo | 4 y 8 mo | 4.8 |
| 40 | 5 y 2 mo | 3 y 10 mo | 5 y 11 mo | 6.0 |
| 45 | 6 y 2 mo | 4 y 5 mo | 7 y 2 mo | 7.3 |
| 50 | 7 y 2 mo | 5 y | 8 y 5 mo | 8.5 |
| 55 | 8 y 2 mo | 5 y 7 mo | 9 y 7 mo | 9.8 |
| 60 | 9 y 2 mo | 6 y 2 mo | 10 y 10 mo | 11.0 |
| 65 | 10 y 2 mo | 6 y 9 mo | 12 y 1 mo | 12.3 |
| 70 | 11 y 2 mo | 7 y 4 mo | 13 y 3 mo | 13.5 |
| 75 | 12 y 2 mo | 7 y 11 mo | 14 y 6 mo | 14.8 |
| 80 | 13 y 6 mo | 8 y 8 mo | 16 y 1 mo | 16.0 |
| 85 | 15 y 11 mo | 10 y 1 mo | 19 y 1 mo | 17.3 |
| 90 | 18 y 4 mo | 11 y 6 mo | 22 y 1 mo | 18.5 |
| 95 | 20 y 10 mo | 12 y 11 mo | 25 y 1 mo | 19.8 |
| 100 | 23 y 3 mo | 14 y 4 mo | 28 y 1 mo | 21.0 |
Below human age 24 every breed gives the same answer. Above it the breeds split: a 70-year-old person matches a Bengal of 7 y 4 mo, a domestic cat of 11 y 2 mo and a Birman of 13 y 3 mo. Past 79 the calculator and the vet chart diverge: a 100-year-old person matches a domestic cat of 23 y 3 mo here and 21.0 years on the chart.
How to calculate cat years by hand
For a domestic or mixed-breed cat:
- Cat to human, 2 to 13 years: human age = 24 + 5 × (cat age – 2). A 10-year-old cat is 24 + 5 × 8 = 64.
- Cat to human, over 13 years: human age = 79 + 2.05 × (cat age – 13). A 15-year-old cat is 79 + 4.1 = 83.1.
- Human to cat, 24 to 79: subtract 24, divide by 5 and add 2. A 50-year-old person is (50 – 24) / 5 + 2 = 7.2 cat years.
- Human to cat, over 79: cat age = 13 + (human age – 79) / 2.05.
- Other breeds: replace 5 with 55 divided by (the breed’s median lifespan – 2), and replace 13 with the median. A Bengal gains 55 / 6.4 = 8.6 human years per cat year and a Birman 55 / 13.5 = 4.1.
- Vet chart shortcut: 15 for year 1, 9 more for year 2, then 4 for each later year. A 10-year-old cat is 24 + 4 × 8 = 56.
Cat years by breed
Breed changes the answer because breeds differ in lifespan. The table gives the human-equivalent age at eight cat ages for 25 breeds, with each breed’s median lifespan in years. Ages past the median describe the minority of cats that live that long.
| Breed | Median lifespan | Lifespan source | 1 y | 3 y | 5 y | 8 y | 10 y | 12 y | 15 y | 18 y |
|---|---|---|---|---|---|---|---|---|---|---|
| Domestic shorthair / mixed | 13.0 | UK data, 7,117 cats | 15 | 29 | 39 | 54 | 64 | 74 | 83 | 89 |
| Ragdoll | 12.2 | UK data, 69 cats | 15 | 29 | 40 | 56 | 67 | 78 | 85 | 92 |
| Maine Coon | 9.8 | UK data, 69 cats | 15 | 31 | 45 | 66 | 80 | 85 | 94 | 103 |
| Persian | 12.5 | UK data, 80 cats | 15 | 29 | 40 | 55 | 66 | 76 | 84 | 91 |
| British Shorthair | 10.9 | UK data, 194 cats | 15 | 30 | 43 | 61 | 73 | 82 | 89 | 97 |
| Siamese | 13.1 | UK data, 88 cats | 15 | 29 | 39 | 54 | 64 | 74 | 83 | 89 |
| Bengal | 8.4 | UK data, 73 cats | 15 | 33 | 50 | 76 | 85 | 92 | 102 | 113 |
| Sphynx | 11.6 | All-purebred average | 15 | 30 | 41 | 58 | 70 | 80 | 87 | 94 |
| Exotic Shorthair | 12.5 | Same as Persian | 15 | 29 | 40 | 55 | 66 | 76 | 84 | 91 |
| Scottish Fold | 11.6 | All-purebred average | 15 | 30 | 41 | 58 | 70 | 80 | 87 | 94 |
| Devon Rex | 11.6 | All-purebred average | 15 | 30 | 41 | 58 | 70 | 80 | 87 | 94 |
| Abyssinian | 11.6 | All-purebred average | 15 | 30 | 41 | 58 | 70 | 80 | 87 | 94 |
| American Shorthair | 11.6 | All-purebred average | 15 | 30 | 41 | 58 | 70 | 80 | 87 | 94 |
| Russian Blue | 11.6 | All-purebred average | 15 | 30 | 41 | 58 | 70 | 80 | 87 | 94 |
| Norwegian Forest Cat | 11.6 | All-purebred average | 15 | 30 | 41 | 58 | 70 | 80 | 87 | 94 |
| Siberian | 11.6 | All-purebred average | 15 | 30 | 41 | 58 | 70 | 80 | 87 | 94 |
| Birman | 15.5 | UK data, 38 cats | 15 | 28 | 36 | 48 | 57 | 65 | 77 | 83 |
| Burmese | 15.3 | UK data, 45 cats | 15 | 28 | 36 | 49 | 57 | 65 | 78 | 84 |
| Himalayan | 12.5 | Same as Persian | 15 | 29 | 40 | 55 | 66 | 76 | 84 | 91 |
| Savannah | 11.6 | All-purebred average | 15 | 30 | 41 | 58 | 70 | 80 | 87 | 94 |
| Bombay | 11.6 | All-purebred average | 15 | 30 | 41 | 58 | 70 | 80 | 87 | 94 |
| Tonkinese | 14.2 | Average of Siamese and Burmese | 15 | 29 | 38 | 51 | 60 | 69 | 80 | 86 |
| Oriental Shorthair | 13.1 | Same as Siamese | 15 | 29 | 39 | 54 | 64 | 74 | 83 | 89 |
| Ragamuffin | 12.2 | Same as Ragdoll | 15 | 29 | 40 | 56 | 67 | 78 | 85 | 92 |
| Cornish Rex | 11.6 | All-purebred average | 15 | 30 | 41 | 58 | 70 | 80 | 87 | 94 |
“UK data” rows use the breed’s own median age at death. All other rows are estimates: the median of a related breed, the average of the two parent breeds or the median of all purebred cats (11.6 years).
The median sets the pace. A 10-year-old Bengal (median 8.4) is 85 in human terms, a 10-year-old Maine Coon (9.8) is 80, a domestic cat is 64 and a Birman (15.5) is 57. That is 28 human years between the Bengal and the Birman. The Siamese median (13.1) is 0.1 years above the domestic cat’s, so the two rows are nearly identical.
The Sphynx row is an estimate. Teng et al. (2024) report the shortest life expectancy of any breed for the Sphynx, 6.68 years, from 18 deaths. That is too few to set the breed apart, so the calculator uses the all-purebred median for it. Related guides: healthy cat breeds, hardy cat breeds and cat breeds for seniors.
How long do cats live?
UK domestic and mixed-breed cats have a median age at death of 13.0 years, and purebred cats 11.6 years (Teng et al. 2024, 7,936 cats that died at UK vets in 2019). Across all 7,936 cats the median is 12.85 years and life expectancy at birth is 11.74 years.
The two figures measure different things. Median age at death is the age that half of the cats that died had passed. Life expectancy at birth is a mean, and kittens that die young pull it down: for crossbred cats the mean is 11.89 and the median 12.96. The calculator uses the median.
In the crossbred data, 25% of cats were still alive at 16.6 years, 10% at 18.7 and 5% at 19.8. A 20-year-old domestic cat is in the oldest 5%. O’Neill et al. (2015, England, 4,009 deaths in 2009-2012) found a median of 14.0 years for crossbred cats (3,621 deaths). The two studies differ by a year for crossbred cats and agree on the order at both ends: Birman and Burmese longest, Bengal shortest.
How long cat breeds live
The Cats column is the number of deaths behind each median. Smaller groups carry wider ranges, and the calculator does not use the three groups under 30 deaths.
| Breed group | Cats (deaths) | Median age at death (Teng 2024) | 95% range | Median in O’Neill 2015 (cats) |
|---|---|---|---|---|
| Birman | 38 | 15.5 | 13.7-17.6 | 16.1 (12) |
| Burmese | 45 | 15.3 | 13.4-17.9 | 14.3 (31) |
| Siamese | 88 | 13.1 | 11.1-14.2 | 14.2 (31) |
| Crossbred (domestic) | 7,117 | 13.0 | 12.8-13.2 | 14.0 (3621) |
| Persian | 80 | 12.5 | 10.2-14.0 | 14.1 (70) |
| Ragdoll | 69 | 12.2 | 9.2-14.0 | 10.1 (21) |
| British cats | 194 | 10.9 | 8.8-12.3 | 11.8 (69) |
| Russian cats | 19 | 10.2 | 4.0-14.6 | – |
| Norwegian Forest Cat | 15 | 10.0 | 6.2-15.0 | – |
| Maine Coon | 69 | 9.8 | 7.5-12.5 | 11.0 (14) |
| Bengal | 73 | 8.4 | 5.8-10.6 | 7.3 (15) |
| Sphynx | 18 | 5.7 | 3.3-11.5 | – |
| All purebred cats | 819 | 11.6 | 10.9-12.2 | 12.5 |
The Birman (15.5) and Burmese (15.3) live longest. Teng et al. give them a life expectancy at birth of 14.39 and 14.42 years. Among breeds with at least 30 deaths, the Bengal (8.4) and Maine Coon (9.8) have the shortest medians. Teng et al. report the lowest life expectancy overall for the Sphynx, 6.68 years from 18 deaths.
These are medians of cats that died in one year at UK clinics. Breeds that grew quickly in popularity, such as the Bengal, Ragdoll and Maine Coon, have many young cats at risk, so they can look shorter-lived than they are.
Do male or female cats live longer?
Female cats live longer. Teng et al. report a life expectancy at birth of 12.51 years for females and 11.18 for males, a gap of 1.33 years. The calculator does not adjust for sex. The gap between breeds is larger: 5.88 years of life expectancy separates the Birman (14.39) from the Bengal (8.51).
Indoor and outdoor cats
No large study has measured indoor and outdoor lifespans side by side. The UK death records list each cat’s breed, sex, neuter status and age at death, not whether it went outside, so the 13.0-year median covers both groups. What the records do show is the main risk outdoors: trauma was the most common cause of death in O’Neill et al. (2015), at 12.2% of all deaths, ahead of kidney disease (12.1%). Indoor cats avoid traffic, fights and most infectious disease, and in exchange they are more prone to weight gain and inactivity. Keeping an indoor cat lean and active removes most of that trade-off.
What helps a cat live longer
Breed and sex are fixed. Care is not. The sources here measure breed and sex, not care, so none of them puts a number on a habit. The factors vets manage across a cat’s life are body weight, dental disease, vaccination, parasite control and regular exams that catch kidney disease, thyroid disease, diabetes and arthritis while they are treatable. From the senior stage at 11, many clinics add bloodwork and six-monthly visits. Ask your vet for a schedule based on your cat’s age and history.
Why the multiply-by-7 rule is wrong
Multiplying a cat’s age by 7 is too low at the start and too high at the end. A 1-year-old cat is 15 on the vet chart and in this calculator, not 7, and a 2-year-old is 24, not 14.
At the other end, 7 × 18 is 126, older than the oldest verified person (122, Jeanne Calment). A 20-year-old cat comes out at 140 by the rule and 93 in this calculator. The middle is closer by coincidence: at 10 years the rule gives 70, nearer to the calculator’s 64 than the vet chart’s 56 is.
The vet chart and how this calculator differs
The AAFP-AAHA Feline Life Stage Guidelines (2010) and International Cat Care publish the same chart: 15 at 1 year, 24 at 2, then 4 for each year, reaching 116 at 25. Raj et al. (2021) call this rule “a very crude approximation”.
This calculator uses the chart’s values for the first 2 years and departs from it after that. The chart’s 4 a year puts a cat at 79, the 2024 US life expectancy, at 15.75 years. UK domestic cats have a median age at death of 13.0 years, so the calculator adds 5.00 a year to put a 13-year-old cat on 79. That is why it runs ahead of the chart from year 3 to 18.
Past the median, each cat year counts 0.41 of an earlier one, because survival data show the last years of the oldest cats are compressed. The chart keeps adding 4 and reaches 116 at 25, where the calculator gives 104. Neither is a measurement of biological age. The chart is a fixed convention, and the calculator ties the scale to how long cats of the breed live.
| Cat age | Calculator (domestic) | Vet chart | Calculator minus chart |
|---|---|---|---|
| 5 | 39.0 | 36 | +3.0 |
| 10 | 64.0 | 56 | +8.0 |
| 13 | 79.0 | 68 | +11.0 |
| 15 | 83.1 | 76 | +7.1 |
| 18 | 89.3 | 88 | +1.3 |
| 19 | 91.3 | 92 | -0.7 |
| 20 | 93.4 | 96 | -2.6 |
| 25 | 103.6 | 116 | -12.4 |
When is a cat a senior, and signs of aging
A cat is a senior from 11 years old. The 2021 AAHA/AAFP guidelines define senior as over 10 years, and International Cat Care places it at 11 to 14. The mature adult stage runs from 7 to 10. In human terms a cat entering the senior stage is 69 if domestic, 60.7 if a Birman and 88.2 if a Bengal.
The feline stages are defined by age alone, unlike the canine guideline, which scales senior to the last quarter of a dog’s lifespan. A cat older than its breed’s median is flagged as past the typical lifespan for the breed: 13.0 years for a domestic cat, 8.4 for a Bengal and 15.5 for a Birman. A 9-year-old Bengal is a mature adult by the guideline and past the typical lifespan by the data.
Signs your cat is getting older, and when to see a vet
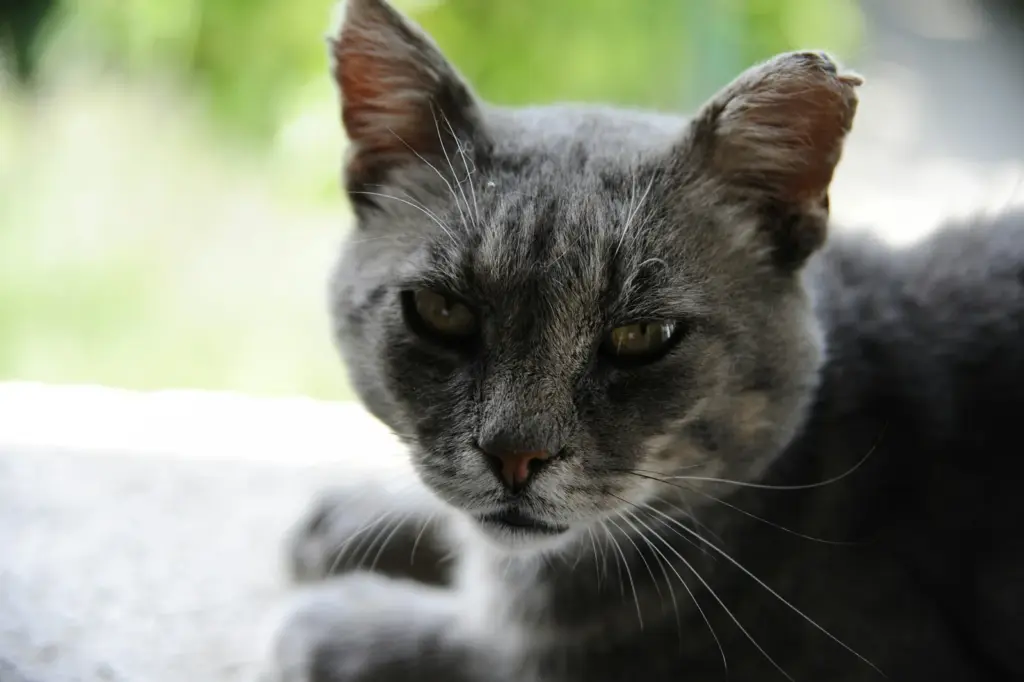
Cats age gradually and hide illness, so the first changes are easy to miss. Common signs include:
- weight loss, or a change in appetite or thirst
- drinking and urinating more than usual
- stiffness, or jumping less onto furniture and windowsills
- a matted or unkempt coat from grooming less
- litter box accidents
- bad breath, drooling or dropping food
- night-time yowling or confusion in familiar rooms
- hiding or less interest in people
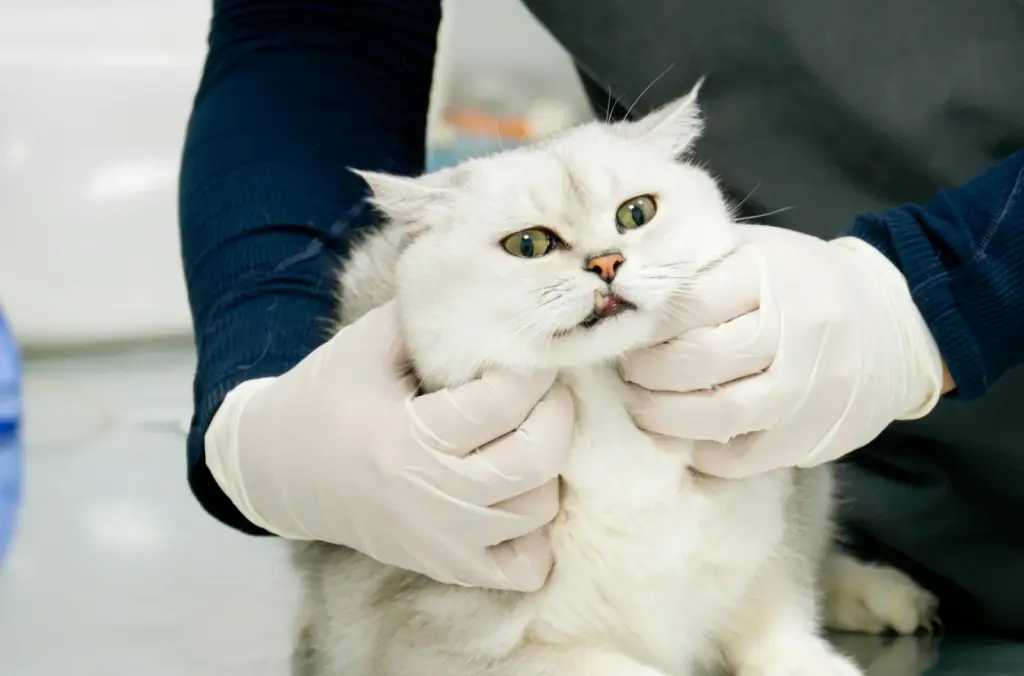
Do not write these off as “just age”. Dental disease, kidney disease, thyroid disease and arthritis all cause them, and all are treatable. Book an exam when the changes begin. The AVMA’s senior pet guidance covers care at this stage.
The oldest cat ever
Creme Puff lived 38 years and 3 days (3 August 1967 to 6 August 2005), the oldest cat on record according to Guinness World Records. That is almost three times the 13.0-year median for domestic cats. In human terms the calculator caps her at 122, which it reaches at a domestic cat age of 34.0. Extending the vet chart’s 4 a year gives 168, and the multiply-by-7 rule gives 266.
Method and sources
The model
- Chart anchors. The first 24 months follow the AAFP-AAHA 2010 chart, identical to International Cat Care’s: 1 month = 1 human year, 2 = 2, 3 = 4, 4 = 6, 5 = 8, 6 = 10, 7 = 12, 12 = 15, 18 = 21 and 24 = 24, with straight lines between. Every breed uses the same anchors.
- Linear to the breed median. From age 2 the scale is a straight line chosen so that the breed’s median age at death maps to 79, the 2024 US life expectancy at birth (CDC NCHS Data Brief 548). The slope is 55 / (median – 2) human years per cat year: 5.0 for a domestic cat, 8.6 for a Bengal and 4.1 for a Birman.
- The slower tail. Past the median, each cat year counts 0.41 of a pre-median cat year. The factor comes from matching the cat ages at which 25%, 10% and 5% of crossbred cats are still alive (16.6, 18.7 and 19.8 years) to the same points in the 2024 US life table (90.2, 95.0 and 97.6 human years). The ratios are 0.395, 0.412 and 0.423 and the least-squares fit is 0.41. Other cat curves give 0.35 for purebred cats, 0.38 for the US Banfield table and 0.41 for all cats. The dog years calculator uses 0.52. The result is capped at 122, the age of the oldest verified person.
- Stages. The stages are the fixed ages of the 2021 AAHA/AAFP guidelines. The guideline’s “over 10 years” is read as 11 completed years, the reading used by the 2010 guideline and International Cat Care.
Data
Breed medians come from the open-access data file of Teng et al. (2024): 7,936 cats that died under VetCompass primary care in the UK in 2019, one row per cat. The medians and their 95% ranges are florafaunafun.com calculations from that file, and the group means reproduce the paper’s published life expectancies to the second decimal. A breed needs at least 30 deaths to get its own median. Groups with 30 or more deaths have 95% ranges at most 5.0 years wide. The three groups with 15 to 19 deaths (Russian cats, Sphynx and Norwegian Forest Cat) have ranges 8.2 to 10.6 years wide.
The calculator has 54 breed profiles. Ten use a measured median. The other 44 are estimates: 7 take the median of a related breed, 1 averages its two parent breeds and 36 use the all-purebred median of 11.6 years. The model uses medians, not Teng’s life expectancy at birth, because early deaths pull the mean 1 to 2 years below the median and mixing the two would shift the anchor.
Validation
- For a domestic cat the calculator is within 5 years of the vet chart for cat years 1 to 7. Over cat years 1 to 25 the largest difference is 12.4 human years and the mean difference is 5.5.
- Converting a human age back to cat years returns the original age to within 0.05 cat years, even after the human age is rounded to one decimal. The scale never decreases between 0 and 40 years.
- O’Neill et al. (2015) agree with Teng et al. on the order at both ends of the breed list. Their medians are higher for 6 of the 9 shared breeds, by 0.6 to 1.6 years.
Limitations
- The breed medians describe UK cats. US cats may differ in care, diet and breeding lines, and no US breed-level source was used.
- The medians come from cats that died in one year. Breeds whose numbers grew quickly can look shorter-lived than they are.
- Thirty-six breeds share the all-purebred median, so their rows are identical. The Sphynx is not modelled as short-lived because its sample has 18 deaths.
- The calculator does not adjust for sex, neuter status or lifestyle.
- There is no epigenetic comparison, which the dog calculator has. Raj et al. (2021) built DNA methylation clocks for cats, but their cross-species clock divides age by each species’ maximum lifespan and the paper gives no formula that converts cat age to human age.
- No measurement defines a cat’s “human age”. Every conversion, including this one, is a model. The calculator estimates how far along its expected life a cat is. It does not predict how long an individual cat will live.
Sources
- Teng KT, Church DB, Brodbelt DC, Pegram C, O’Neill DG (2024). Life tables of annual life expectancy and risk factors for mortality in cats in the UK. Journal of Feline Medicine and Surgery 26(5). doi:10.1177/1098612X241234556. Open data: doi:10.6084/m9.figshare.25006802
- O’Neill DG, Church DB, McGreevy PD, Thomson PC, Brodbelt DC (2015). Longevity and mortality of cats attending primary care veterinary practices in England. Journal of Feline Medicine and Surgery 17(2):125-133. doi:10.1177/1098612X14536176
- Montoya M, Morrison JA, Arrignon F et al. (2023). Life expectancy tables for dogs and cats derived from clinical data. Frontiers in Veterinary Science 10:1082102. doi:10.3389/fvets.2023.1082102
- Vogt AH, Rodan I, Brown M et al. (2010). AAFP-AAHA Feline Life Stage Guidelines. Journal of Feline Medicine and Surgery 12(1):43-54. The “Life stages in cats” chart is also published by International Cat Care (icatcare.org) as “How old is your cat?”.
- Quimby J, Gowland S, Carney HC, DePorter T, Plummer P, Westropp J (2021). 2021 AAHA/AAFP Feline Life Stage Guidelines. Journal of Feline Medicine and Surgery 23(3):211-233.
- Raj K et al. (2021). Epigenetic clock and methylation studies in cats. GeroScience 43:2363.
- Kochanek KD, Murphy SL, Xu JQ, Arias E (2026). Mortality in the United States, 2024. NCHS Data Brief 548 (US life expectancy 79.0 years), and United States Life Tables, 2024 (NVSR 75-05), Table 1.
- Guinness World Records. Oldest cat ever: Creme Puff, 38 years 3 days.
- AVMA. Caring for senior cats and dogs.
The breed lifespans are derived from data released under CC BY 4.0. The medians, estimates and all conversions are florafaunafun.com calculations, and the original authors did not review or endorse them.
Is 1 cat year 7 human years?
No. One cat year is not 7 human years at any age. A 1-year-old cat is 15 in human terms and a 2-year-old is 24, so each of the first two years is worth far more than 7. After that a domestic cat gains about 5 human years per cat year to age 13 and about 2 after that, which puts a 15-year-old at 83 where multiplying by 7 gives 105.
How old is a 1, 5, 10, 15 or 20-year-old cat in human years?
A domestic cat is 15 at 1 year, 39 at 5, 64 at 10, 83 at 15 and 93 at 20 in human years. The vet chart gives 15, 36, 56, 76 and 96 for the same ages, and a 2-year-old is 24 on both. Breed changes the middle ages: a 10-year-old Bengal is 85 and a 10-year-old Birman is 57.
How old is a 6-month-old kitten in human years?
A 6-month-old kitten is 10 in human years. A 3-month-old is 4, a 9-month-old is 13.2 and a 12-month-old is 15. These values are the same for every breed because they follow the AAFP-AAHA kitten chart.
How long do indoor cats live?
No large study has measured indoor cats separately, so the best figure is the overall one: UK domestic cats have a median age at death of 13.0 years, and 25% are still alive at 16.6. Indoor cats avoid the leading cause of death in UK cats, trauma (12.2% of deaths in O'Neill et al. 2015), which mostly happens outdoors. Keeping an indoor cat lean and active offsets the main indoor risks, weight gain and inactivity.
How long do cats live?
UK domestic cats have a median age at death of 13.0 years and purebred cats 11.6 years. Life expectancy at birth for all cats is 11.74 years, a mean that early deaths pull down. In the crossbred data 25% of cats were still alive at 16.6 years, 10% at 18.7 and 5% at 19.8. The oldest cat on record, Creme Puff, lived 38 years.
When is a cat a senior?
A cat is a senior from 11 years old. The 2021 AAHA/AAFP guidelines define kitten as birth to 1 year, young adult as 1 to 6, mature adult as 7 to 10 and senior as over 10, with end of life possible at any age. An 11-year-old domestic cat is 69 in human years. Many clinics add bloodwork and six-monthly exams at the senior stage.
Do male or female cats live longer?
Female cats live longer. Teng et al. (2024) report a life expectancy at birth of 12.51 years for UK females and 11.18 years for males, a gap of 1.33 years. This calculator does not adjust for sex.
Which cat breeds live longest?
The Birman and Burmese live longest in UK data, with median ages at death of 15.5 and 15.3 years. Teng et al. (2024) give a life expectancy at birth of 14.39 years for the Birman (38 deaths) and 14.42 for the Burmese (45 deaths). The Siamese (13.1), Persian (12.5) and Ragdoll (12.2) sit near the domestic cat's 13.0. Among breeds with at least 30 deaths the shortest medians are the Bengal at 8.4 and the Maine Coon at 9.8.
What is the oldest cat ever?
The oldest cat on record is Creme Puff, who lived 38 years and 3 days (3 August 1967 to 6 August 2005), according to Guinness World Records. That is almost three times the 13.0-year median for domestic cats. The calculator caps her at 122 human years, the age of the oldest verified person, and the multiply-by-7 rule gives 266.
How do you calculate cat years by hand?
For a domestic cat, count 15 for year 1 and 24 for year 2, then add 5 for each year up to age 13 and about 2 for each year after. As formulas: 24 + 5 x (cat age – 2) up to age 13, which is 79, then 79 + 2.05 x (cat age – 13). A 10-year-old cat is 24 + 5 x 8 = 64. The vet chart shortcut adds 4 for each year after year 2, which makes a 10-year-old 56.
How do you convert human years to cat years?
For a domestic cat, subtract 24 from the human age, divide by 5 and add 2, for human ages from 24 to 79. A 50-year-old person is (50 – 24) / 5 + 2 = 7.2 cat years, or 7 years 2 months. A 15-year-old person matches a 1-year-old cat and a 24-year-old matches a 2-year-old. Above 79, use 13 + (human age – 79) / 2.05. For other breeds, replace 5 with 55 divided by (the breed's median lifespan – 2).
Do mixed-breed cats live longer?
On average, yes. Mixed-breed cats in UK data have a median age at death of 13.0 years against 11.6 for purebred cats, and O'Neill et al. (2015) found 14.0 against 12.5 in England. It does not hold for every breed: the Birman (15.5) and Burmese (15.3) outlive the crossbred median and the Siamese (13.1) matches it.
Why does this calculator differ from the vet chart?
The calculator matches the AAFP-AAHA chart for the first 2 years, then scales to the breed's lifespan instead of adding a flat 4 human years per cat year. For a domestic cat it adds 5.00 a year to age 13, which maps the median age at death of 13.0 onto the human life expectancy of 79, and about 2 a year after that. The result runs up to 11 years ahead of the chart between ages 3 and 18 and falls behind it from age 19.